Dubai Property Market Report — September 2026
Dubai's residential property market recorded 10,373 sales transactions worth AED 23.63 billion during September 2026. Off-plan property accounted for 69.3% of transactions, while ready properties represented 30.7%.
This report reviews sales activity, transaction values, resale participation, villa and townhouse performance, rentals, yields and selected community trends using aggregated Property Monitor data.
- Reporting period
- September 2026
- Data captured
- 5 October 2026
- Source
- Property Monitor

Dubai Property Market at a Glance
- Residential Sales
- 10,373
- −7.0% MoM
- Sales Value
- AED 23.63B
- −1.2% MoM
- Off-plan Share
- 69.3%
- of transactions
- Average Sale Price
- AED 2.28M
- +6.3% MoM
- Residential Rental Contracts
- 51,326
- −4.6% MoM
- Average Gross Yield
- 6.34%
- Aug 2026, latest
MoM = change on the previous month. Average gross yield is the latest available reading (August 2026).
Dubai Residential Sales Activity
Off-plan property made up more than two-thirds of September activity, with 7,188 off-plan transactions against 3,185 ready transactions.
Transaction activity was 7.0% lower than August and 46.1% lower than September 2025, which recorded the highest monthly transaction count of the past 13 months.
- Residential sales transactions
- 10,373
- Off-plan69.3%7,188 transactions
- Ready30.7%3,185 transactions
Source: Property Monitor (aggregated DLD data), captured 5 October 2026. Chart drawn by Seven Century from aggregate figures.
Dubai Residential Sales Value
Off-plan property generated 60.6% of sales value, below its 69.3% share of transactions, because ready homes carried a higher average transaction value during the month: AED 2.93 million for ready transactions.
Total sales value was 1.2% lower than August, while the average sale price rose 6.3% month-on-month.
- Total residential sales value
- AED 23.63B
- Average sale price
- AED 2.28M
- Off-plan60.6%AED 14.31B
- Ready39.4%AED 9.32B
Source: Property Monitor (aggregated DLD data), captured 5 October 2026. Chart drawn by Seven Century from aggregate figures.
Apartment vs Villa & Townhouse Activity
Apartments accounted for the majority of Dubai residential transactions during September 2026, while villas and townhouses recorded 1,505 sales.
Villa and townhouse activity increased 6.5% compared with August, making the segment one of the stronger-performing parts of the residential market during the month.
Off-plan villa and townhouse transactions were also significantly higher than one year earlier: 765 in September 2026 against 467 in September 2025 (+63.8%).
- Villa & townhouse transactions
- 1,505
- Villa & townhouse sales value
- AED 9.12B
- Apartments85.5%8,868 transactions
- Villas & townhouses14.5%1,505 transactions
Source: Property Monitor (aggregated DLD data), captured 5 October 2026. Chart drawn by Seven Century from aggregate figures.
Resale Activity Strengthened
Resale transactions accounted for 35% of all residential sales during September, compared with 24% one year earlier. A total of 3,602 resales were recorded, up 13.9% from August.
Off-plan resales also increased, reaching 782 transactions, up 28.8% month-on-month and 7.9% year-on-year, so secondary-market activity grew across both completed and off-plan property.
Resale figures come from Property Monitor Sales Transactions Analysis (resale vs first sale). Its monthly totals differ slightly from the headline series, so shares are calculated within that module only.
- Resale transactions
- 3,602
- +13.9% MoM · −20.0% YoY
- Off-plan resales
- 782
- +28.8% MoM · +7.9% YoY
- Sep 202635.0%
- Aug 202629.0%
- Sep 202524.1%
Dubai Rental Market
Dubai recorded 51,326 residential Ejari contracts during September 2026, with new leases accounting for approximately 51% of activity.
Contract volumes were lower than both August and September 2025, but Property Monitor's latest rental index (August 2026, latest available) stood at AED 75.8 per sq ft, 5.63% higher year-on-year.
- Residential Ejari contracts
- 51,326
- −4.6% MoM · −10.3% YoY
- New leases
- 51%
- 26,278 new · 25,045 renewals
- Rental index per sq ft
- AED 75.8
- +0.28% MoM · +0.46% quarter · +5.63% YoY
Rental index: August 2026, latest available.
New leases vs renewals · August 2026, latest available
Renewals +6.13% YoY · New leases −2.06% YoY
Renewal rents remained stronger than new-lease rents, contributing to the overall annual increase in the rental index.
Rental Yield Opportunities
Dubai's average gross residential rental yield stood at 6.34% in August 2026, based on the latest available Property Monitor data.
Gross rental yields vary by property, building, purchase price, service charges and operating costs. These figures should be used as market indicators rather than guaranteed investment returns.
- Dubai average 6.34%
- Dubai Investments Park9.71%
- International City8.90%
- International City 28.04%
- Dubai Production City8.02%
Communities Showing Positive Price Momentum
Property Monitor's September community data shows that 63 of 95 tracked residential segments remained above their year-ago price levels.
Seventeen segments were positive across their 3-month, 6-month and 12-month comparisons.
Change in median price per sq ft, Property Monitor Community Price Trends. Community-level price movements can be influenced by transaction mix, project launches and the number of transactions recorded during a period.
| Community | 3 months | 6 months | 12 months |
|---|---|---|---|
| Jumeirah Village TriangleVillas | +10.2% | +18.1% | +33.4% |
| Jaddaf WaterfrontApartments | +13.2% | +26.4% | +29.3% |
| Living LegendsApartments | +6.5% | +11.2% | +25.1% |
| MeydanApartments | +5.2% | +9.3% | +13.4% |
Dubai Property Price Index
Property Monitor's latest Dubai residential price index stood at AED 1,632 per square foot in August 2026.
The index was broadly stable month-on-month and 1.9% below the same period a year earlier.
This Dubai-wide figure should be considered alongside the significant differences visible between individual communities, property types and market segments.
August 2026, latest available. The September 2026 index had not been published at the time of capture.
- Price per sq ft
- AED 1,632
- August 2026, latest available
- Month-on-month
- −0.2%
- August vs July 2026
- Year-on-year
- −1.9%
- August 2026 vs August 2025
What the Data Tells Us
Resale participation increased
The secondary market took a 35% share of September sales, up from 24% a year earlier.
Villa and townhouse activity improved
Villa and townhouse sales grew 6.5% month-on-month while overall volume eased, generating AED 9.12 billion.
Average transaction values increased
Value held up better than volume, lifting the average sale price 6.3% month-on-month to AED 2.28 million.
Rental values remain above last year
The rental index (August 2026, latest available) was 5.63% above last year, despite fewer September contracts.
Seven Century View
September's figures show a Dubai property market with different levels of performance across individual segments rather than one single market-wide trend.
Overall transaction volume was lower than both August and the same month last year, but resale participation increased, villa and townhouse activity improved month-on-month, and average transaction values moved higher.
Off-plan property continued to account for most transactions, and the rental market remains supportive for investors: the latest rental index remains above year-ago levels and Dubai's average gross residential yield stood at 6.34%.
What This Means for Dubai Property Investors
Dubai continues to offer a wide range of opportunities across off-plan, ready and income-generating residential property.
September's market data suggests that investors should pay particular attention to segment-level performance, including the communities still recording positive longer-term price movement, rather than relying solely on Dubai-wide averages.
The strongest opportunity will not necessarily be the area with the highest short-term price growth. Investors should consider entry price, developer quality, payment plan, rental demand, future supply and their intended holding period before making a decision.
Browse current off-plan projects, ready properties for sale or Dubai community guides to compare options.
About This Report
This report uses aggregated market data from Property Monitor captured on 5 October 2026. September sales and rental contract figures reflect the data available at the time of publication. Property Monitor's latest published price and rental indices were for August 2026 and are labelled accordingly.
Market data may be revised after initial publication as additional transactions are registered or datasets are updated. Figures in this report are intended for general market information and should not be considered financial or investment advice.
Explore Dubai Investment Opportunities
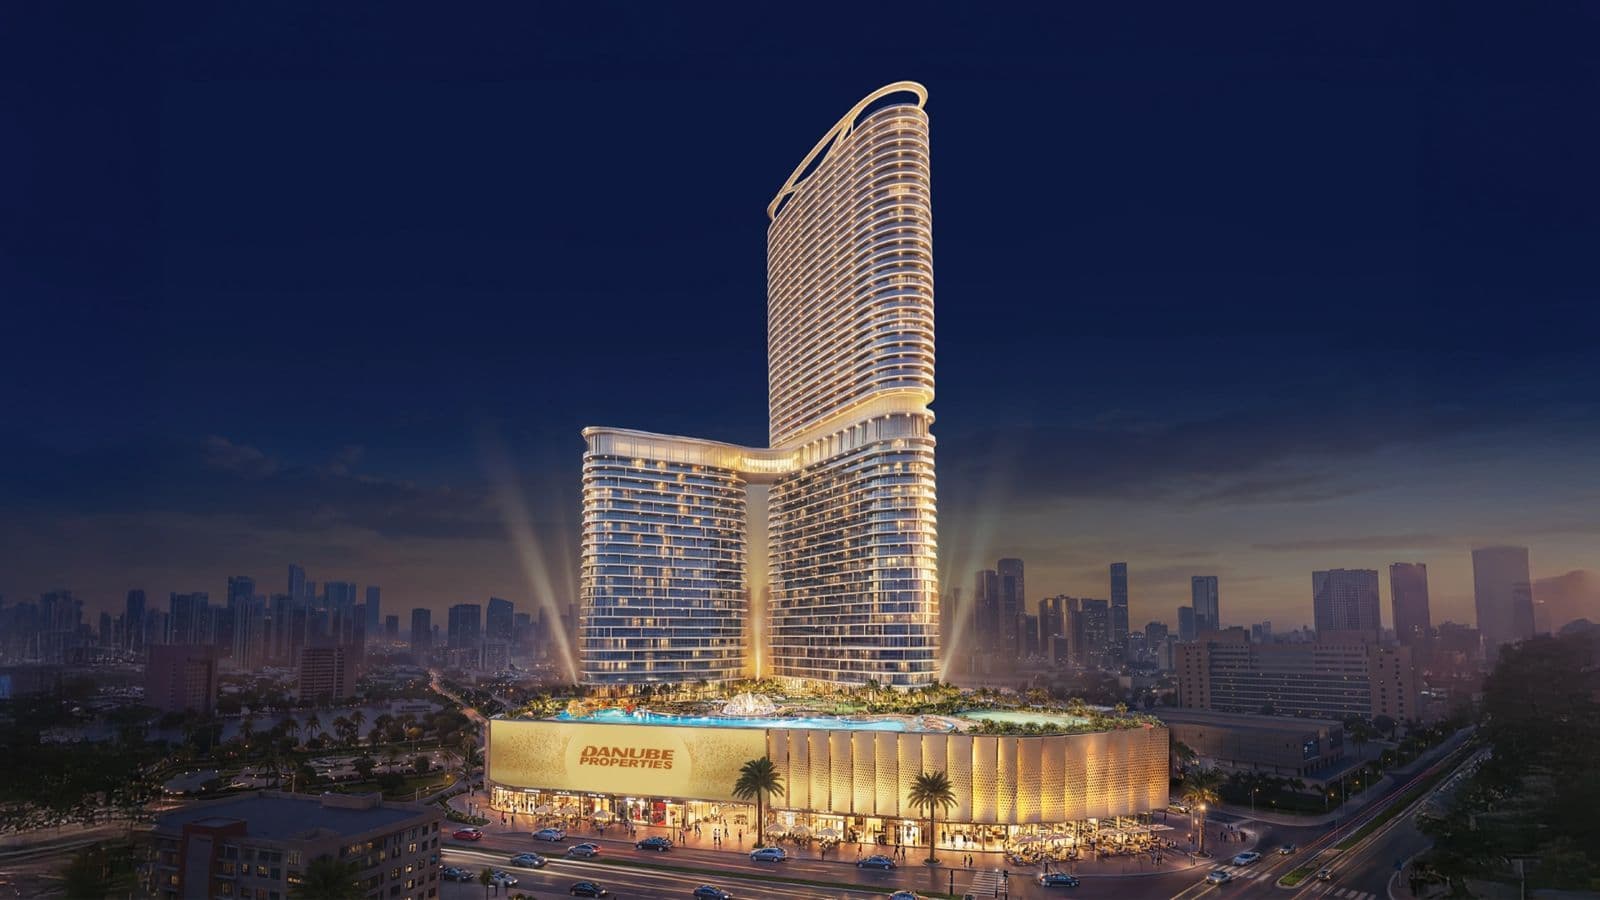
Serenz by Danube at Jumeirah Village Circle
Jumeirah Village Circle · Apartment
From AED 1,100,000
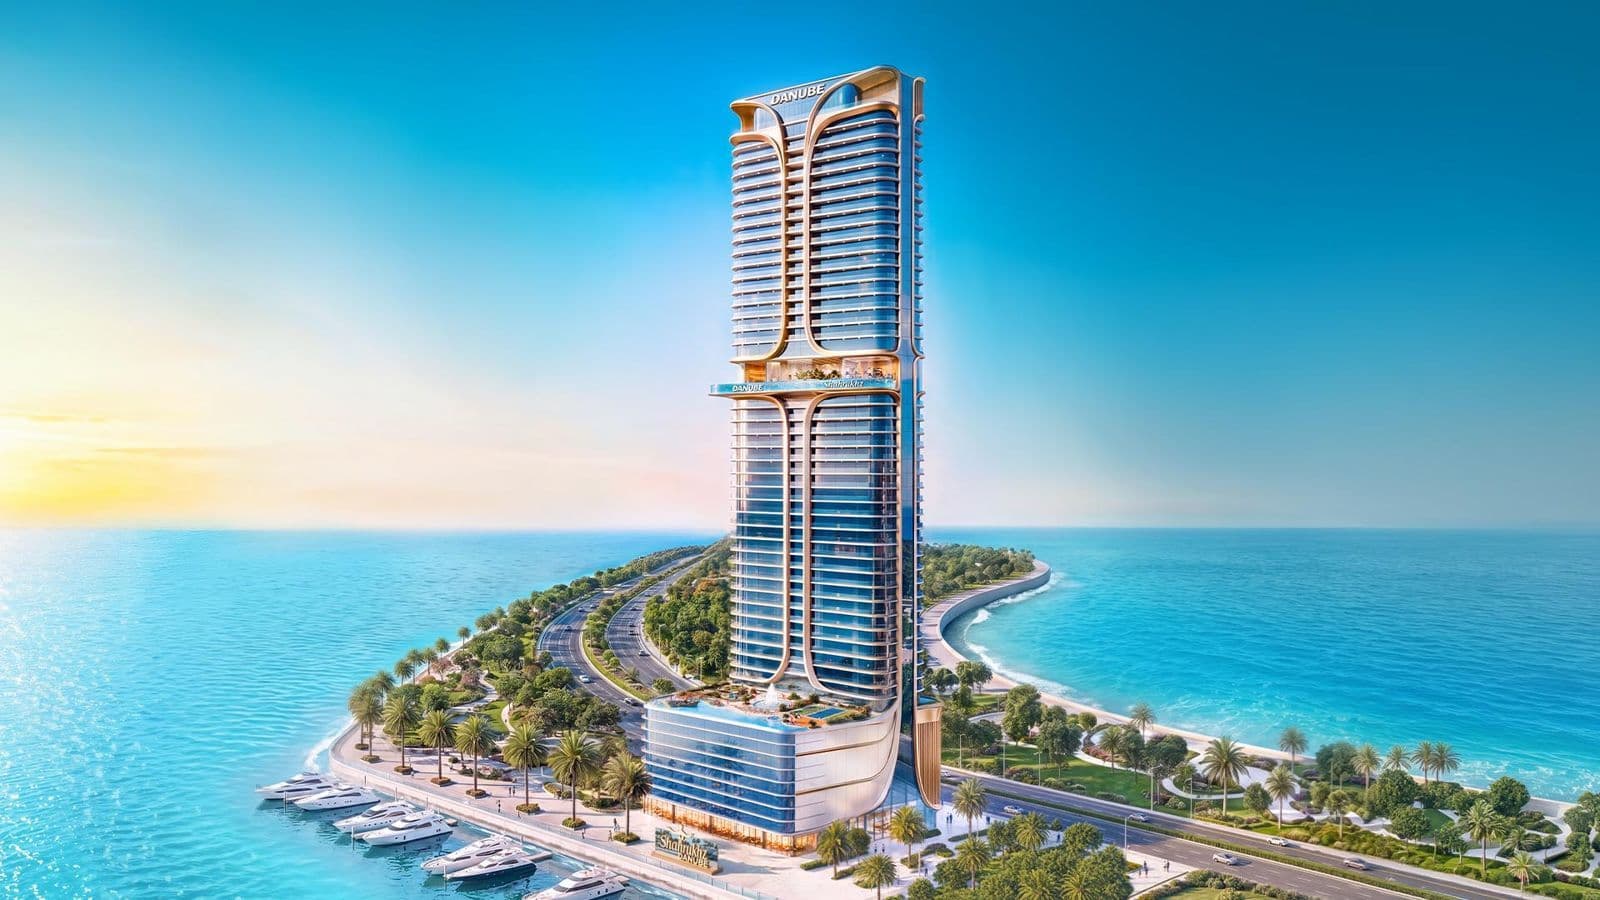
Shahrukhz Residences by Danube at Dubai Maritime City
Dubai Maritime City · Apartment
From AED 1,650,000
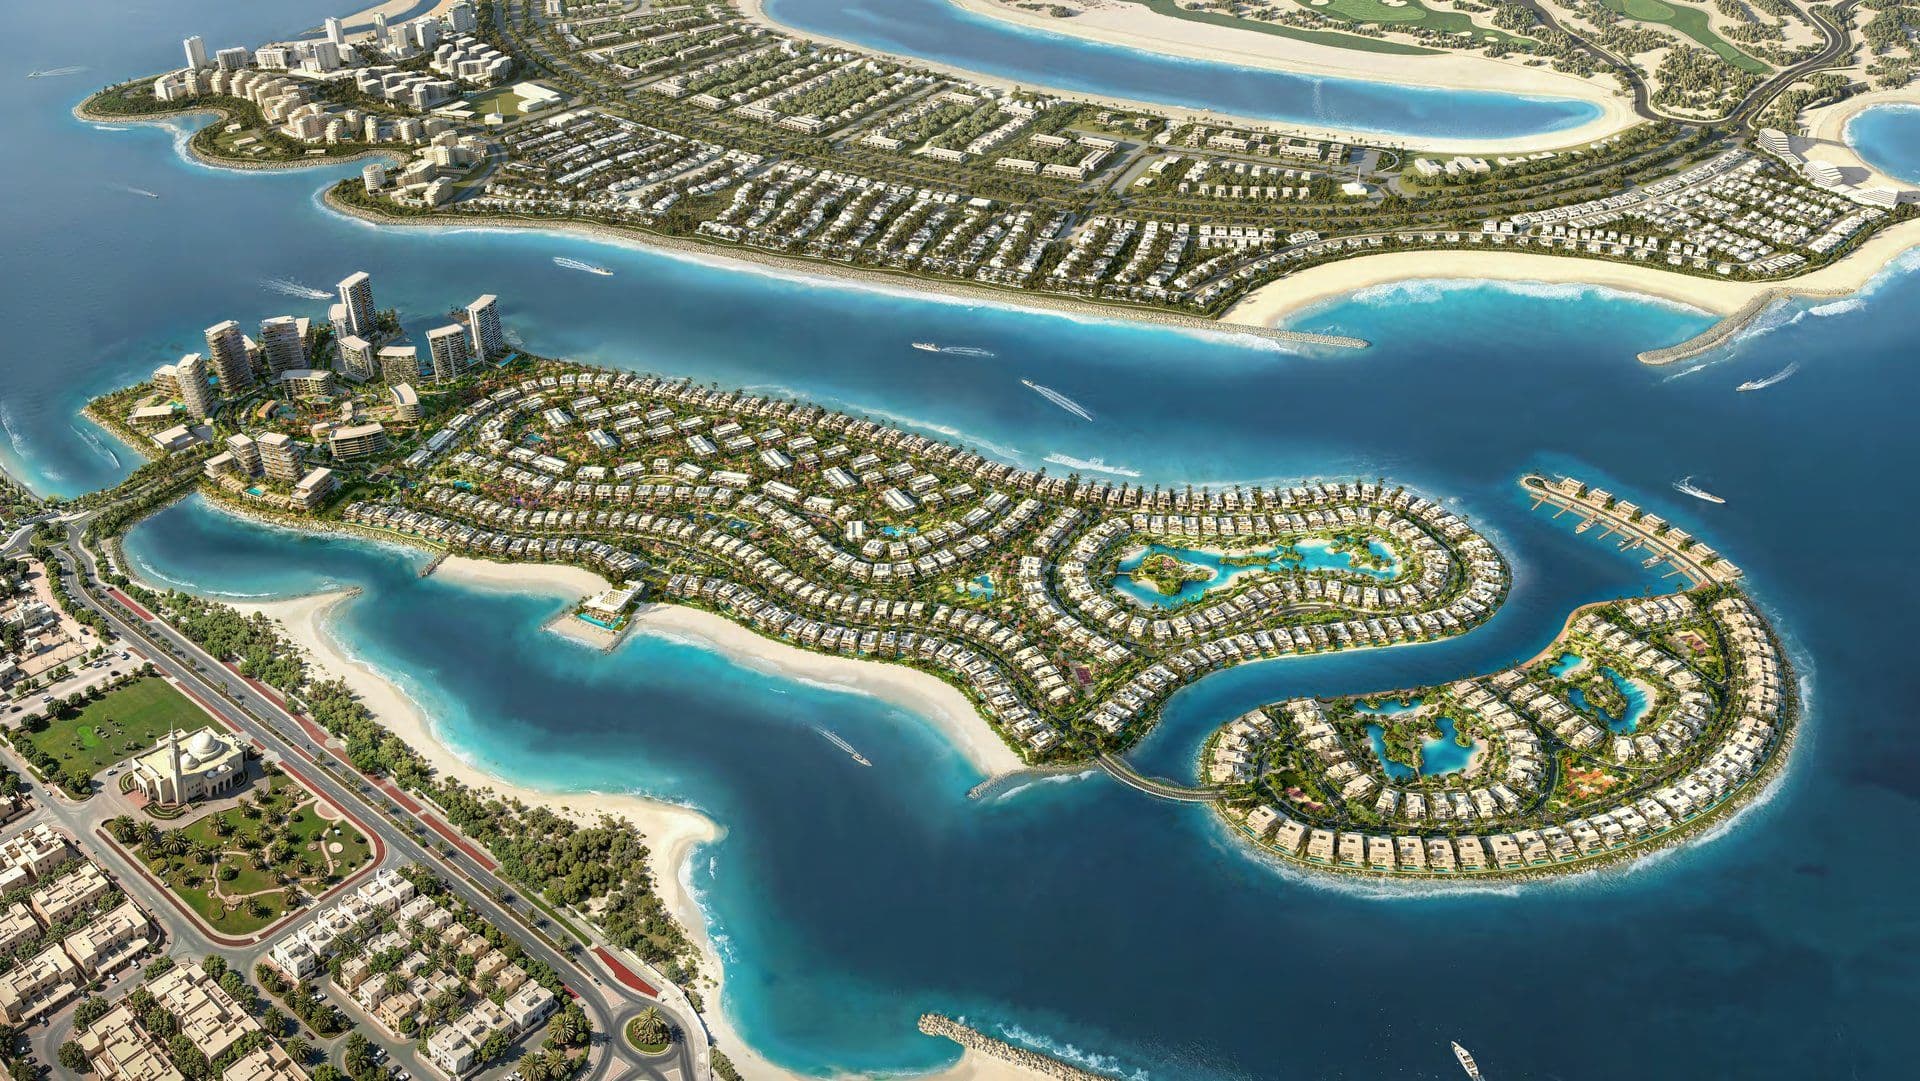
Bay Estate at Dubai Islands by Nakheel
Dubai Islands · Villa
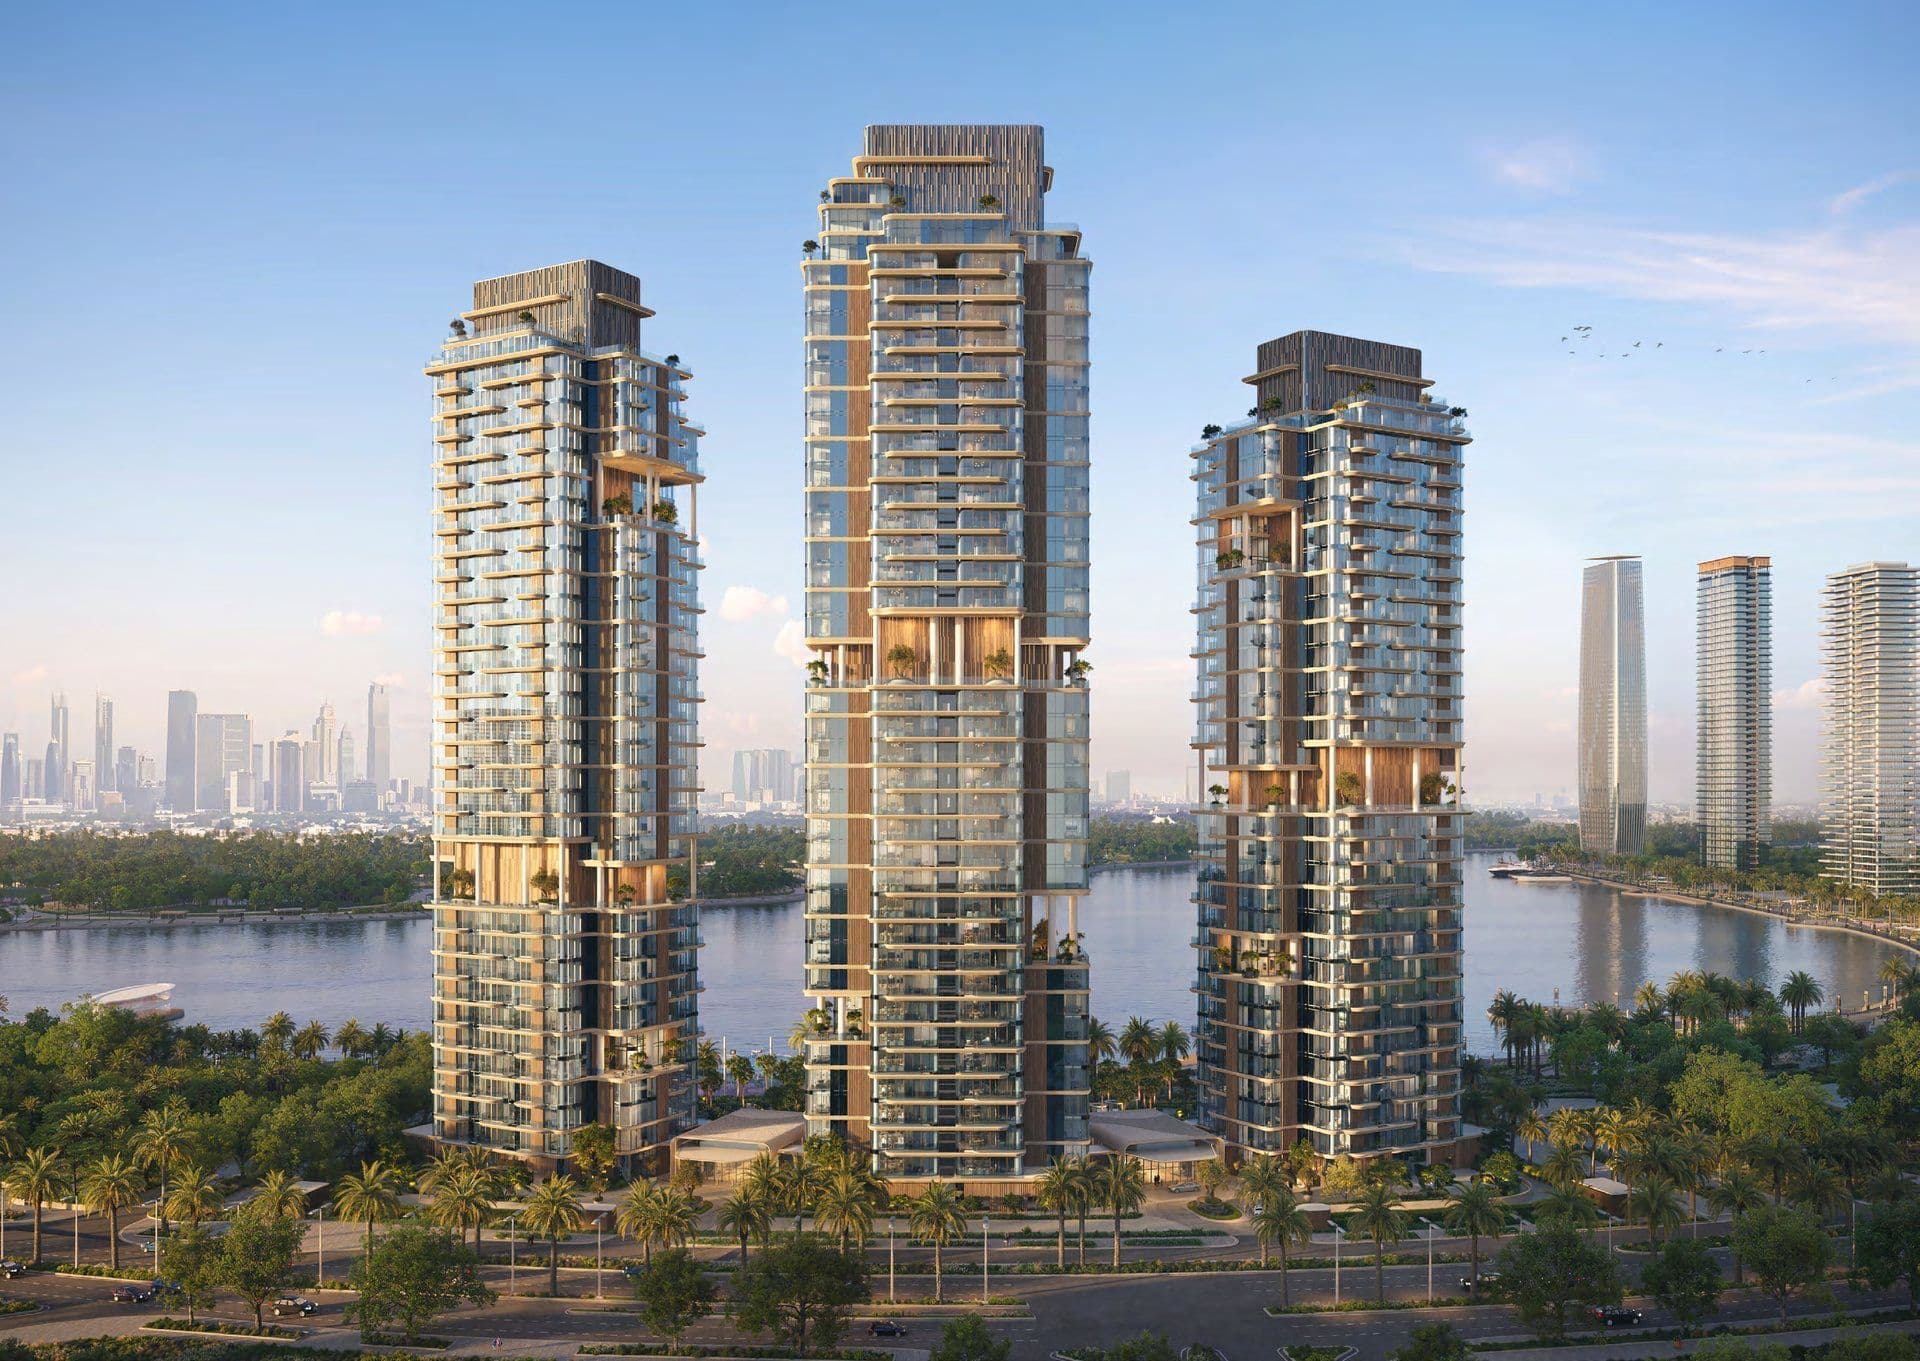
The Edit at d3 by Meraas
Dubai Design District · Apartment
From AED 2,000,000
Speak to a Dubai Property Advisor
Looking to invest in Dubai? Our team can help you compare communities, projects and property types based on your budget and investment goals.